Mouse MOp (MERFISH)
[1]:
import numpy as np
import pandas as pd
import pathlib
import matplotlib.pyplot as plt
import matplotlib as mpl
import seaborn as sns
import scanpy as sc
import pickle

import sys
sys.path.append('../src')
from utils import *

import warnings
warnings.filterwarnings('ignore')
Preprocessing scRNA-ref
Ideally, the scRNAseq reference should from the exact same tissue that contains all the celltypes you expect to find in ST spots.
We will use a mouse MOp snRNA-seq as reference dataset, the raw dataset in h5ad format (mop_sn_tutorial.h5ad) is available in here.
Conveniently, we provided the pre-pocessed scRNA-ref (Ckpts_scRefs/MOp/Ref_snRNA_mop_qc3_2Kgenes.h5ad) as well as other relevent materials involved in the following example in here, so you can skip this part
[15]:
ad_sc = sc.read('mop_sn_tutorial.h5ad')

cell_type_column = 'subclass_label'
ad_sc.obs[cell_type_column] = ad_sc.obs[cell_type_column].astype(str)

ad_sc.obs.loc[ad_sc.obs[cell_type_column]=='Micro-PVM',cell_type_column] = ad_sc.obs.loc[
    ad_sc.obs[cell_type_column]=='Micro-PVM','cluster_labels'].map(
    lambda x: 'Micro' if x=='Micro' else 'PVM').values
ad_sc.obs.loc[ad_sc.obs[cell_type_column]=='Oligo',cell_type_column] = ad_sc.obs.loc[
    ad_sc.obs[cell_type_column]=='Oligo','cluster_labels'].map(
    lambda x: 'OPC' if x=='OPC Pdgfra' else ('Oligo' if x in ['Oligo Opalin_2','Oligo Opalin_1'] else None)).values
ad_sc = ad_sc[ad_sc.obs['cluster_labels']!='Pvalb Vipr2_2']
ad_sc = ad_sc[ad_sc.obs.index.isin(ad_sc.obs.groupby(cell_type_column).apply(
    lambda x: x.sample(frac=2000/x.shape[0],replace=False) if x.shape[0]>5000 else
        (x.sample(frac=1000/x.shape[0],replace=False) if x.shape[0]>1000 else x)
            ).reset_index(level=0,drop=True).index)]

cell_types = ['L5 IT',
 'Oligo',
 'L2/3 IT',
 'L6 CT',
 'Astro',
 'Pvalb',
 'L6 IT',
 'L5 ET',
 'L5/6 NP',
 'Sst',
 'Vip',
 'L6b',
 'Endo',
 'Lamp5',
 'VLMC',
 'Peri',
 'Sncg']+['OPC','Micro','PVM']
ad_sc = ad_sc[ad_sc.obs[cell_type_column].isin(cell_types)]
sc.pp.filter_cells(ad_sc, min_counts=500)
sc.pp.filter_cells(ad_sc, max_counts=30000)
sc.pp.filter_genes(ad_sc, min_cells=10)
ad_sc = ad_sc[:,~np.array([_.startswith('MT-') for _ in ad_sc.var.index])]
ad_sc = ad_sc[:,~np.array([_.startswith('mt-') for _ in ad_sc.var.index])]

ad_sc.X.max(),ad_sc.shape
[15]:
(3438.0, (13456, 22174))
[16]:
if ad_sc.X.max()<20:
    ad_sc.X = np.exp(ad_sc.X)-1
plt.hist(ad_sc.X.sum(1),bins=100)
plt.show()

[17]:
ad_sc.raw = ad_sc.copy()
sc.pp.normalize_total(ad_sc, inplace=True)

sc.pp.highly_variable_genes(ad_sc, flavor='seurat_v3',n_top_genes=1000)
sc.tl.rank_genes_groups(ad_sc, groupby=cell_type_column, method='wilcoxon')
markers_df = pd.DataFrame(ad_sc.uns["rank_genes_groups"]["names"]).iloc[0:30, :]
markers = list(np.unique(markers_df.melt().value.values))
markers = list(set(ad_sc.var.loc[ad_sc.var['highly_variable']==1].index)|set(markers)) # highly variable genes + cell type marker genes

ligand_recept = list(set(pd.read_csv('../extdata/ligand_receptors.txt',sep='\t').melt()['value'].values))
# if scRNA-seq reference is from human tissue, run following code to make gene name consistent
# ligand_recept = [_.upper() for _ in ligand_recept]

ad_sp = sc.read('../demo_data/MERFISH_mop.h5ad')
merfish_genes = ad_sp.var.index.values.tolist()

add_genes = 'Nos1ap Erbb4 Atp2b4 Adamts3 Cdh4 Celf2 Crispld1 Esrrg Htr4 Kcnh5 Prkg1 3110035E14Rik Garnl3 Pvalb Cplx3 Fam84b Otof Slc17a6 Tenm3 Opalin Cdh12 Enpp6 Kcng1 Igf2 Kcnh5'.split() # some important genes that we interested

markers = markers+merfish_genes+add_genes+ligand_recept
len(set(markers))
WARNING: It seems you use rank_genes_groups on the raw count data. Please logarithmize your data before calling rank_genes_groups.
[17]:
2135
[18]:
ad_sc.var.loc[ad_sc.var.index.isin(markers),'Marker'] = True
ad_sc.var['Marker'] = ad_sc.var['Marker'].fillna(False)
ad_sc.var['highly_variable'] = ad_sc.var['Marker']

sc.pp.log1p(ad_sc)
sc.pp.pca(ad_sc,svd_solver='arpack', n_comps=30, use_highly_variable=True)

ad_sc.X.max()
[18]:
7.553706
[19]:
sc.pp.neighbors(ad_sc, metric='cosine', n_neighbors=30, n_pcs = 30)
sc.tl.umap(ad_sc, min_dist = 0.5, spread = 1, maxiter=60)
[20]:
fig, axs = plt.subplots(1, 1, figsize=(10, 10))
sc.pl.umap(
    ad_sc, color=cell_type_column, size=15, frameon=False, show=False, ax=axs,legend_loc='on data'
)
plt.tight_layout()

[21]:
#ad_sc.write('../Ckpts_scRefs/MOp/Ref_snRNA_mop_qc3_2Kgenes.h5ad')
[ ]:
[ ]:
Learning the gene expression distribution of scRNA-seq reference using score-based model
We use four GPUs to train scRNA-seq reference in parallel.
python ./src/Train_scRef.py \
--ckpt_path ./Ckpts_scRefs/MOp \
--scRef ./Ckpts_scRefs/MOp/Ref_snRNA_mop_qc3_2Kgenes.h5ad \
--cell_class_column subclass_label \
--gpus 0,1,2,3
The checkpoints and sampled psuedo-cells will be saved in ./Ckpts_scRefs/MOp, e.g, model_5000.pt, model_5000.h5ad
Conveniently, we provided the pre-trained checkpoint (Ckpts_scRefs/MOp/model_5000.pt) in here, so you can skip this part
[ ]:
Run SpatialScope
Step 1: Preprocessing MERFISH data
[25]:
ad_sp = sc.read('../demo_data/MERFISH_mop.h5ad')

ad_sp.obs = ad_sp.obs.rename(columns = {'X':'x', 'Y':'y'})
cell_locations = ad_sp.obs.copy()
cell_locations['spot_index'] = np.array(cell_locations.index)
cell_locations['cell_index'] = cell_locations['spot_index'].map(lambda x:x+'_0')
cell_locations['cell_nums'] = np.ones(cell_locations.shape[0]).astype(int)
ad_sp.uns['cell_locations'] = cell_locations

ad_sp.write('../demo_data/MERFISH_mop_preprocess.h5ad')
[45]:
ad_sp.shape
[45]:
(5551, 247)
Step 2: Cell type identification
Step 3: Gene expression imputation
set -ex;
declare -a arr=(“0,1000” “1000,2000” “2000,3000” “3000,4000” “4000,5000” “5000,5551”)
for i in “${arr[@]}”
do
done
[ ]:
Cell type identification result (Fig. a)
[37]:
color_dict = {'Astro': '#1f77b4',
 'Endo': '#aec7e8',
 'L2/3 IT': '#ff7f0e',
 'L5 ET': '#ffbb78',
 'L5 IT': '#2ca02c',
 'L5/6 NP': '#98df8a',
 'L6 CT': '#d62728',
 'L6 IT': '#ff9896',
 'L6b': '#9467bd',
 'Lamp5': '#c5b0d5',
 'Micro': '#8c564b',
 'Oligo': '#c49c94',
 'OPC': '#e377c2',
 'Peri': '#f7b6d2',
 'Pvalb': '#7f7f7f',
 'PVM': '#a3a2a2',
 'Sncg': '#bcbd22',
 'Sst': '#dbdb8d',
 'Vip': '#17becf',
 'VLMC': '#9edae5',
 'None': '#dbd9d9'}

labelnames = ['Astro', 'Endo', 'L2/3 IT', 'L5 IT', 'L5 ET', 'L5/6 NP', 'L6 IT', 'L6 CT', 'L6b', 'Lamp5', 'Micro', 'Oligo', 'OPC', 'Peri', 'Pvalb',
'PVM', 'Sncg', 'Sst', 'Vip', 'VLMC']
[32]:
ad_sp = sc.read('../output/merfish/sp_adata.h5ad')
[35]:
p2_res = ad_sp.uns['cell_locations']
[39]:
sns.set_context('paper',font_scale=2)
plt.subplots(figsize=(10,10),dpi=150)
sns.scatterplot(data=p2_res, x="x", y="y", hue="discrete_label_ct",hue_order=labelnames,s=15,palette=color_dict)
plt.legend(bbox_to_anchor=(1.0,0.98), loc="upper left",framealpha=0,markerscale=1.5)
plt.gca().invert_yaxis()
plt.axis('off')
plt.show()

[40]:
sns.set_context('paper',font_scale=4.5)
plt.subplots(figsize=(10,10),dpi=150)
ex_neuronal = ['L2/3 IT', 'L5 IT', 'L5 ET', 'L5/6 NP', 'L6 IT', 'L6 CT', 'L6b']
p2_res_plot = p2_res.copy()
p2_res_plot.loc[~p2_res_plot['discrete_label_ct'].isin(ex_neuronal),'discrete_label_ct']='None'
p2_res_plot_None = p2_res_plot.loc[p2_res_plot['discrete_label_ct']=='None']
p2_res_plot_NonNone = p2_res_plot.loc[p2_res_plot['discrete_label_ct']!='None']
p2_res_plot = p2_res_plot_None.append(p2_res_plot_NonNone)
sns.scatterplot(data=p2_res_plot, x="x", y="y", hue="discrete_label_ct",hue_order=ex_neuronal,s=25,palette=color_dict)
plt.legend(bbox_to_anchor=(.92,0.92), loc="upper left",framealpha=0,markerscale=4.5)
plt.gca().invert_yaxis()
plt.axis('off')
plt.show()
/home/share/xiaojs/software/netMHCpan-4.1/Linux_x86_64/tmp/ipykernel_32499/1305571735.py:8: FutureWarning: The frame.append method is deprecated and will be removed from pandas in a future version. Use pandas.concat instead.
  p2_res_plot = p2_res_plot_None.append(p2_res_plot_NonNone)

[42]:
color_dict['None'] = '#e3e1e1'

sns.set_context('paper',font_scale=4.5)
plt.subplots(figsize=(10,10),dpi=150)
inh_neuronal = ['Lamp5', 'Sncg', 'Vip', 'Sst', 'Pvalb']
p2_res_plot = p2_res.copy()
p2_res_plot.loc[~p2_res_plot['discrete_label_ct'].isin(inh_neuronal),'discrete_label_ct']='None'
p2_res_plot_None = p2_res_plot.loc[p2_res_plot['discrete_label_ct']=='None']
p2_res_plot_NonNone = p2_res_plot.loc[p2_res_plot['discrete_label_ct']!='None']
p2_res_plot = p2_res_plot_None.append(p2_res_plot_NonNone)
sns.scatterplot(data=p2_res_plot, x="x", y="y", hue="discrete_label_ct",hue_order=inh_neuronal,s=25,palette=color_dict)
plt.legend(bbox_to_anchor=(.92,0.82), loc="upper left",framealpha=0,markerscale=4.5)
plt.gca().invert_yaxis()
plt.axis('off')
plt.show()
/home/share/xiaojs/software/netMHCpan-4.1/Linux_x86_64/tmp/ipykernel_32499/486759856.py:10: FutureWarning: The frame.append method is deprecated and will be removed from pandas in a future version. Use pandas.concat instead.
  p2_res_plot = p2_res_plot_None.append(p2_res_plot_NonNone)

[43]:
sns.set_context('paper',font_scale=4.5)
plt.subplots(figsize=(10,10),dpi=150)
non_neuronal = ['Astro', 'Endo', 'Micro','OPC','Peri','PVM','VLMC','Oligo']
p2_res_plot = p2_res.copy()
p2_res_plot.loc[~p2_res_plot['discrete_label_ct'].isin(non_neuronal),'discrete_label_ct']='None'
p2_res_plot_None = p2_res_plot.loc[p2_res_plot['discrete_label_ct']=='None']
p2_res_plot_NonNone = p2_res_plot.loc[p2_res_plot['discrete_label_ct']!='None']
p2_res_plot = p2_res_plot_None.append(p2_res_plot_NonNone)
sns.scatterplot(data=p2_res_plot, x="x", y="y", hue="discrete_label_ct",hue_order=non_neuronal,s=25,palette=color_dict)
plt.legend(bbox_to_anchor=(.92,0.96), loc="upper left",framealpha=0,markerscale=4.5)
plt.gca().invert_yaxis()
plt.axis('off')
plt.show()
/home/share/xiaojs/software/netMHCpan-4.1/Linux_x86_64/tmp/ipykernel_32499/1395075864.py:8: FutureWarning: The frame.append method is deprecated and will be removed from pandas in a future version. Use pandas.concat instead.
  p2_res_plot = p2_res_plot_None.append(p2_res_plot_NonNone)

[ ]:
UMAP of single cell reference data (Fig. b)
[46]:
ad_sc = sc.read('../Ckpts_scRefs/MOp/Ref_snRNA_mop_qc3_2Kgenes.h5ad')
sampled_cells = sc.read('../Ckpts_scRefs/MOp/model_5000.h5ad') # 2K cells sampled from the learned gene expression distribution of scRef
cell_type_key=cell_type_column
sns.set_context('paper',font_scale=1.5)
adata_all = PlotSampledData(sampled_cells,ad_sc,cell_type_key,palette=color_dict)
/home/jxiaoae/.conda/envs/SpatialScope/lib/python3.9/site-packages/anndata/_core/merge.py:942: UserWarning: Only some AnnData objects have `.raw` attribute, not concatenating `.raw` attributes.
  warn(
/home/jxiaoae/.conda/envs/SpatialScope/lib/python3.9/site-packages/anndata/_core/anndata.py:1785: FutureWarning: X.dtype being converted to np.float32 from float64. In the next version of anndata (0.9) conversion will not be automatic. Pass dtype explicitly to avoid this warning. Pass `AnnData(X, dtype=X.dtype, ...)` to get the future behavour.
  [AnnData(sparse.csr_matrix(a.shape), obs=a.obs) for a in all_adatas],


[ ]:
[ ]:
Imputation of Non-MERFISH genes (Fig. d)
[169]:
# We start by concatenating all the generated_cells_spotX_X.h5ad together
ad_res = ConcatCells(s=0,e=6000,inter=1000,es=5551,file_path='../output/merfish/',prefix='generated_cells_spot',suffix='.h5ad')
[173]:
non_genes=['cdh4','crispld1','prkg1','kcnh5','atp2b4','nos1ap','adamts3']
[174]:
plot_genes_sc(non_genes, adata_measured=ad_sp, adata_predicted=ad_res, x='x',y='y',spot_size=50, scale_factor=0.1, perc=0.02, return_figure=False)

[175]:
non_genes=['Cdh4','Crispld1','Prkg1','Kcnh5','Atp2b4','Nos1ap','Adamts3']
sns.set_context('paper',font_scale=1.5)
fig, ax = plt.subplots(figsize=(2.5,12),dpi=150)
sc.pl.matrixplot(sc_data_process_plot, non_genes, groupby=cell_type_column, swap_axes=True,ax=ax,colorbar_title='expression',standard_scale='var',categories_order=layers)
plt.show()

[ ]:
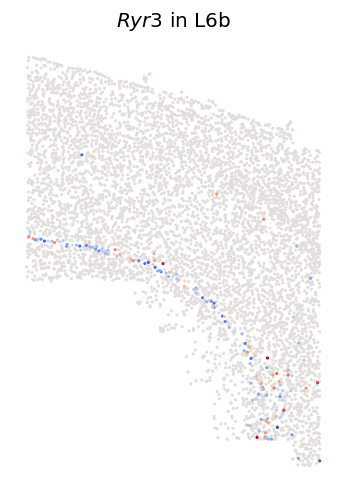
Cell-type specific spatially DE genes (Fig. g-h)
[176]:
def VisualscDE(ad_sc,gene):
    tmp = ad_sc[:,gene].X
    tmp = (tmp - tmp.min()) / (tmp.max() - tmp.min())
    ad_sc.obs['visual_gene'] = tmp
    fig, axs = plt.subplots(1, 1, figsize=(10, 10))
    sc.pl.umap(
        ad_sc, color="visual_gene", size=12, frameon=False, show=False, ax=axs, cmap='coolwarm',title='${}$'.format(gene)
    )
    plt.tight_layout()
[178]:
gene = 'Ryr3'
ct = 'L6 CT'
fig, ax = plt.subplots(1, 1, figsize=(12, 6),dpi=100)
PlotVisiumGene(ad_res,gene,0.8,perc=0.005,ax=ax,vis_index=ad_res.obs['discrete_label_ct']==ct,vis_index_0=False,
               palette='coolwarm',colorbar_loc=None,title='${}$ in {}'.format(gene,ct))
plt.show()

[180]:
gene = 'Ryr3'
ct = 'L6b'
fig, ax = plt.subplots(1, 1, figsize=(12, 6),dpi=100)
PlotVisiumGene(ad_res,gene,0.8,perc=0.005,ax=ax,vis_index=ad_res.obs['discrete_label_ct']==ct,vis_index_0=False,
               palette='coolwarm',colorbar_loc=None,title='${}$ in {}'.format(gene,ct))
plt.show()
[181]:
sns.set_context('paper',font_scale=2)
gene = 'Ryr3'
VisualscDE(adata_all,gene)

[ ]:
[ ]:
Benchmarking imputation accuracy (Fig. c)
set -ex;
declare -a arr=(“0,1000” “1000,2000” “2000,3000” “3000,4000” “4000,5000” “5000,5551”)
for i in “${arr[@]}”
do
done
[ ]:
[169]:
# We start by concatenating all the generated_cells_spotX_X.h5ad together
ad_res = ConcatCells(s=0,e=6000,inter=1000,es=5551,file_path='../output/merfish/',prefix='generated_cells_spot',suffix='.h5ad')
[170]:
test_genes = 'Cux2, Otof, Rorb, Rspo1, Sulf2, Fezf2, Osr1'.split(', ')
test_genes = [_.lower() for _ in test_genes]
[171]:
plot_genes_sc(test_genes, adata_measured=ad_sp, adata_predicted=ad_res, x='x',y='y',spot_size=50, scale_factor=0.1, perc=0.02, return_figure=False)

[ ]:
[172]:
layers = ['L2/3 IT', 'L5 IT', 'L6 IT', 'L6 CT', 'L6b']
sc_data_process_plot = ad_sc[ad_sc.obs[cell_type_column].isin(layers)]
test_genes = 'Cux2, Otof, Rorb, Rspo1, Sulf2, Fezf2, Osr1'.split(', ')
sns.set_context('paper',font_scale=1.5)
fig, ax = plt.subplots(figsize=(2.5,12),dpi=150)
sc.pl.matrixplot(sc_data_process_plot, test_genes, groupby=cell_type_column, swap_axes=True,ax=ax,colorbar_title='expression',standard_scale='var',categories_order=layers)
plt.show()

[ ]: